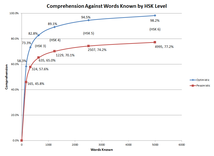
This graph shows the percentage of all spoken words that you can expect to understand, against how many words you know, at each Level of the 2012 New HSK. Word frequency data is from SUBTLEX-CH. Of course, being able to understand for example 50% of a block of words will often mean that you still can't understand the meaning at all; for example if you were at HSK level 1 and you were presented with ”一个熊猫", you would understand ”一个" and which means "one of something", but you would have no idea that the thing being talked about is a panda ("熊猫").
There are two lines plotted, an 'optimistic' and a 'pessimistic' estimate. The difference between these two estimates is caused partly by difficulties in defining what constitutes a 'word' in Chinese. The pessimistic estimate is as strict as possible, only counting a word in the frequency list as being known if it explicitly appears in the HSK lists. The optimistic estimate is more permissive, counting a word in the frequency lists as 'known' if all its component characters are part of the HSK word list.
As an example, the HSK lists have the words 我们, 你, 他, 她, and 它, but they don't have the words 你们, 他们, 她们, or 它们 which the frequency list does have. Of course, the pattern of adding 们 to pluralise is pretty simple once you have learned it, so it is pointless to for the HSK list to have all of these combinations. The optimistic estimate would count all those -们 words as known, but the pessimistic estimate would count them as not known, so the optimistic estimate is probably better in this example. On the other hand, the HSK lists don't have 美国, which is quite common, although they do use the characters 美 and 国, so the optimistic estimate is probably wrong to count 美国 as known. The true answer would be somewhere between the two estimates, but my feeling is that the 'optimistic' estimate is closer, as so many highly used words in the frequency list are easy to understand combinations of other known words.
The Excel file used to generate this graph is available for download here.
 RSS Feed